
Metropolitan Planning Organization
859 Willamette St.
Suite 500
Eugene, OR 97401
Ph: 541-682-4405
Fx: 541-682-4099
Email: mpo@lcog.org
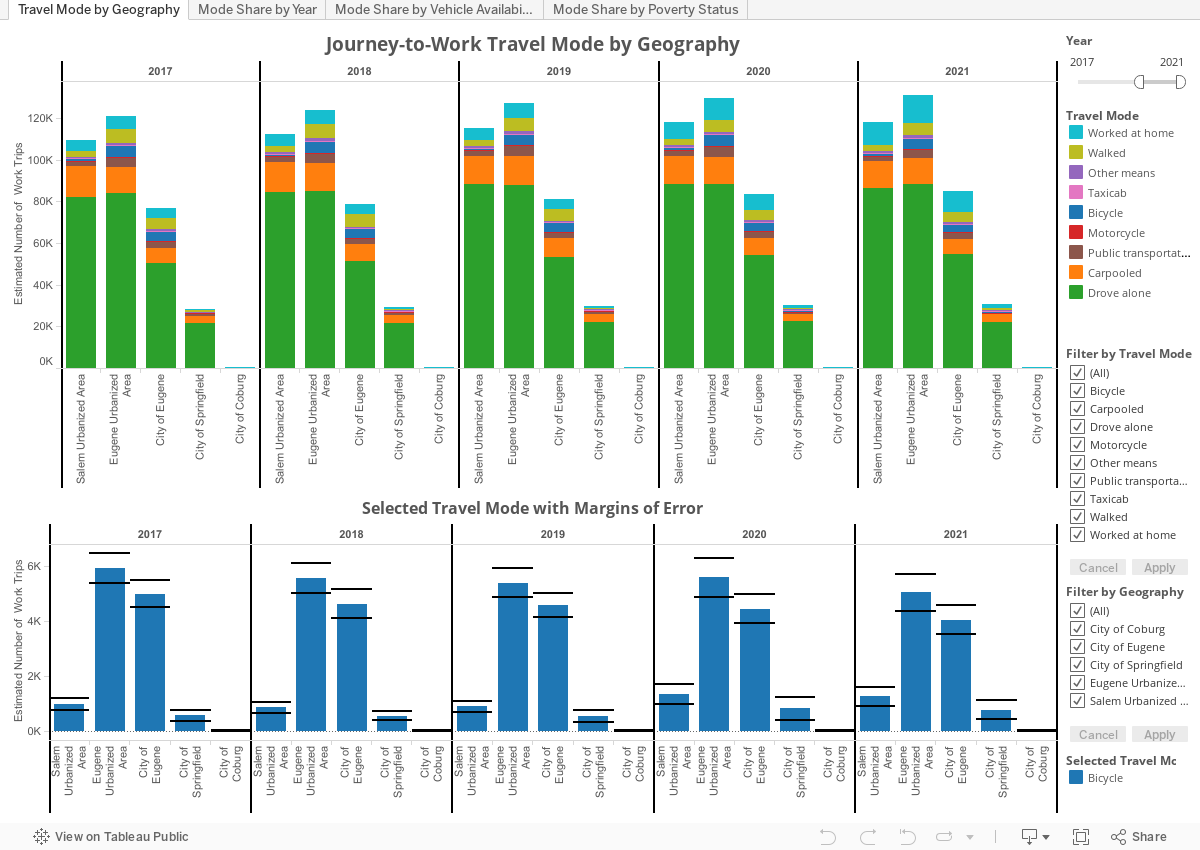
Click on the four tabs below to explore Journey to Work data related to travel mode for the Central Lane MPO Area. Note that the data pertain ONLY to Journey to Work travel, not ALL travel.
Data shown are 5-year estimates from the American Community Survey (ACS). Years shown are the ending years of each 5-year sampling period. For example, 2009 represents the 5-year ACS estimates based on sampling conducted from 2005-2009. In some cases, corresponding data from the 2000 decennial Census are also shown.
The Eugene Urbanized Area is defined by the Census Bureau, and approximates the Central Lane Transportation Management Area (the MPO Area). Salem Urbanized Area is included for sake of comparison.
Hover over any data element to see the estimated value and the associated margin of error.
Click on any data category to highlight that category. Click again to release.
Use the filters provided to more closely examine specific travel modes or geographies. On the first two tabs, the selected travel mode will be shown in the lower graphs with associated margins of error (MoE). Smaller geographies, such as the City of Coburg, have much smaller samples and therefore tend to have relatively large margins of error, and larger variability from year to year.
Other tabs show mode share by vehicle availability and mode share by poverty status. Use the filters provided to more closely examine specific modes, geographies, or categories.
Sources of ACS 5-year Journey-to-Work data are as follows:
Travel Mode: Table B08301
Travel Mode by Vehicle Availability: Table B08141
Travel Mode by Poverty Status: Table B08122
Metropolitan Planning Organization
859 Willamette St.
Suite 500
Eugene, OR 97401
Ph: 541-682-4405
Fx: 541-682-4099
Email: mpo@lcog.org