
Metropolitan Planning Organization
859 Willamette St.
Suite 500
Eugene, OR 97401
Ph: 541-682-4405
Fx: 541-682-4099
Email: mpo@lcog.org
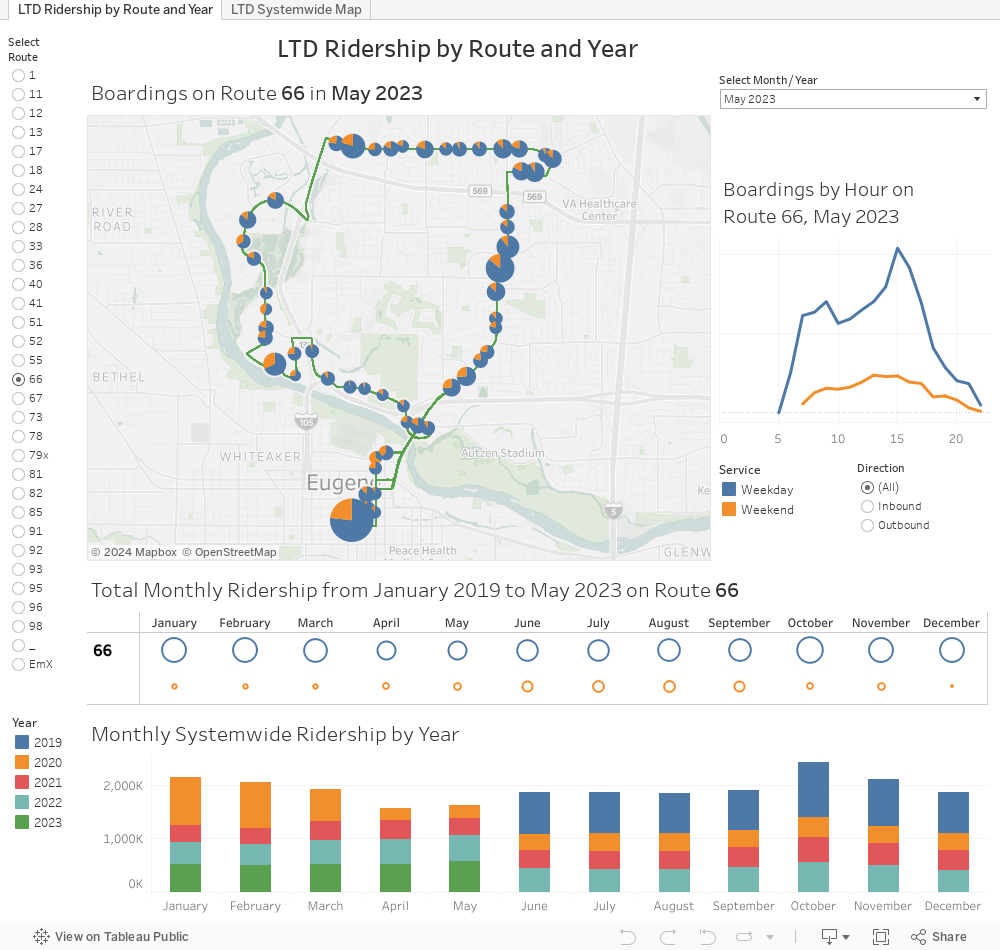
The dashboard below shows passenger boardings recorded by automatic passenger counter (APC) equipment installed on Lane Transit District (LTD) buses. This equipment automatically records when passengers get on or off the bus. The map and charts below represent boardings on and off. The dashboard shows monthly ridership between January 2019 and December 2022 from data provided by LTD.
The first tab displays LTD ridership by Route and Month Year. The map shows passenger boardings along each bus route for the selected sampling period. You can select bus route and sampling period(s), and choose whether to display inbound boardings, outbound boardings, or both. Boarding data are broken out by weekday versus weekend service. Hover over the stops to show details. The smaller line chart shows the hour-by-hour distribution of those boardings. Hover your mouse along that line chart to display the hour-by-hour distribution of those boardings among the stops (you will need to pause to allow the map to re-draw). The circle chart below the map summarizes the monthly boardings from January 2018 to May 2021 for the selected route over time. Hover over the individual boxes to show details. The bar graph at the bottom of the dashboard shows the systemwide monthly boardings by year.
The second tab provides a more system-wide look at LTD ridership. Select a sampling period from the list, and hover over the map to see ridership details for each route. You can select a specific route by clicking on the map and see monthly ridership on that route from 2017 to 2021 in the bar chart below the map. Highlighting a route in the right-hand legend can help you find that route on the map. Click the map again to release the selection or make a new selection.
Metropolitan Planning Organization
859 Willamette St.
Suite 500
Eugene, OR 97401
Ph: 541-682-4405
Fx: 541-682-4099
Email: mpo@lcog.org