Latest Census News
September 2018
In recognition of the start of the annual "data release season", let's take an updated look at a favorite topic of argument in this neck of the woods, namely the question of which city is #2 in Oregon, is it Salem or Eugene?
The argument persists because the two primary sources of city-by-city population estimates have long disagreed on the answer. The latest (2017) estimates have just been released by the Census Bureau's Population Estimates Program (PEP). In Oregon, however, many cities and state agencies have long relied on the annual population estimates released each December by the Population Research Center at Portland State University (PSU). In both cases, the estimates are "as of" July 1st of each year, and both rely on essentially the same methodology: tracking births and deaths and net migration from year to year. The chart below shows the estimates for both Eugene (blue) and Salem (orange). The darker lines are the PSU estimates, which have consistently shown Eugene to have a larger population than Salem. The lighter lines are the estimates from the PEP, which have shown Salem as having a slightly larger population since 2013. Presumably, the 2020 Census will settle the argument, at least for awhile.

Previous Posts
September 2018
It's that time of the decennial Census cycle when demographers begin to speculate about which states are likely to gain or lose Congressional seats based on the results of the next full headcount in 2020. (The apportionment of seats in the House of Representatives was the original purpose behind the Census.) Last time around, there was some speculation that it was going to be Oregon's turn to gain a seat, but our growth was outpaced by other states, and it didn't happen. However, after seven additional years of growth, our average House District population is among the largest in the US, and it is highly likely that Oregon will gain a seat this time around.
Only four states have a larger average House District population than Oregon's, and all of them are states with only one or two Representatives: Montana, Delaware, South Dakota, and Idaho.It is impossible to add a seat to those very small states without suddenly rocketing them from being the most under-represented to being the most over-represented (or vice versa, by taking a seat away). For example, with just over one million residents and just one seat in the House, Montana is currently the most under-represented, but if Montana were to gain a second seat (which it might), splitting that one million residents, it would suddenly join Rhode Island at the opposite end of the ranking. Conversely, if Rhode Island were to lose one of its two seats, it would jump all the way to where Montana is now, with over a million residents and just one seat.
It is far easier to add or take away seats from the largest states, because there are plenty of other Districts to take up the slack. California is the granddaddy of them all with 53 seats, but at the moment, California is sitting smack dab in the middle of the pack, so for the first time in a long time, California is unlikely to gain another seat. Both Florida and Texas are likely to gain a seat (or two), and New York is likely to lose one.
Oregon currently has five Congressional Districts, and adding a sixth would at first bring our average District population down well below the national average, but we will almost certainly continue to gain population, and move closer to the average with each passing year. Other likely gainers this time include Colorado and North Carolina. Likely losers include Alabama, Minnesota, and Illinois. Demographers will be carefully tracking growth over the next year in all of these states. If Oregon does gain a seat, as expected, it will be up to the State Legislature to determine how to configure the new map. Perhaps a new District will be created close to the largest population center, where most of the growth has been occurring, and the other Districts will shift to make room as needed. But if the Legislature cannot agree on a map, the task may fall to the Governor's office instead.
December 2017
This month, the Population Research Center (PRC) at Portland State University has released 2017 Certified Population Estimates for all cities and counties in Oregon, and the Census Bureau has released new five-year estimates from the American Community Survey (ACS).
October 2017
Census data users from around the state recently attended the annual Census Data Users Workshops held in Portland and in Salem. Census Bureau staff presented an overview of preparations underway for the 2020 Census. Current plans call for the 2020 Census to be carried out for about the same budget ($12.5 B) as the 2010 Census ($12.3 B). This represents a major decrease from past practice. If the budget for the 2020 Census had grown from 2010 based on budget trends for past Censuses and on population growth, it was projected to have been about $17.8 B. The sharp reduction means the Census will be carried out with half as many offices and about half as many staff on the ground. To achieve this reduction in cost for the 2020 Census, the Bureau will rely on efficiency and innovation, including the option to respond to the Census via internet, and the use by the Census Bureau of certain personal and household information already provided to various government programs, in order to reduce the follow-up workload for non-response. Other savings will come about through more efficiently targeted address canvassing in advance of the Census, and not the 100% address canvassing which was conducted prior to 2010.
Workshop attendees were also told about changes being made to the actual Census Questionnaire. Census questions continue to evolve over time, and the big changes this time around have to do with Race and Ethnicity. The Bureau is changing long-standing practice of having separate questions for race and for Hispanic ethnicity. Instead, respondents will choose from among several racial/ethnic descriptions (and more than one can be selected, as before), and one of those choices will be Hispanic. Another big change is the introduction of Middle Eastern and North African (MENA) as a new race/ethnicity category. Those regions were previously lumped in with European as part of the definition of “White”. This change came about through lobbying by members of the MENA ethnic community, who felt they were not adequately represented by any of the choices in the previous versions of the Census questionnaire. With this introduction of MENA as a separate category, "White" now essentially means European. In addition, the element of Ancestry or National Origin is being rolled into the new race/ethnicity question. If a respondent chooses Hispanic, for example, he or she can then choose from a variety of sub-categories, such as Mexican, Puerto Rican, Guatemalan, etc., with a space to fill in if a check box is not provided. If a respondent chooses White for the race response (or for one of their race responses), they can check or fill in one or more specific European countries/regions
As always, getting the word out is another major area of preparation for the 2020 Census. At the state level, the Bureau will be setting up Complete Count Commissions in each state. At the local level, they will be establishing Complete Count Committees, just as they did in the lead-up to 2010. They will be relying on local contacts to help identify key people in historically hard-to-reach communities, non-English speakers, the poor, seniors, people with disabilities, etc.
Census Bureau staff also updated Workshop attendees on developments related to the future roll-out of a new data access and retrieval platform that will replace the American Fact Finder. The new platform, to be known as data.census.gov, is expected to go live in June 2018. American Fact Finder will remain available until at least June 2019, according to information provided at the Workshop.
Finally, attendees also learned about recent changes to the Oregon Population Forecast Program, which is conducted by the Population Research Center at PSU. At the outset of the program a few years ago, the state was divided into three regions. Lane County was part of Region 1, and forecasts for all cities in Lane County were completed in the first year of the program. However, that map of the state is being reconfigured to consist of four regions instead of three, and Lane County is no longer part of Region 1, so there will be at least a one-year delay in getting our updated forecasts. The makeup of the other three regions is still “to be determined”, but hopefully we will get picked up in the next round.
August 2017
The once-per-decade program known as Local Update of Census Addresses (LUCA) is getting underway, and the Census Bureau has begun sending out Registration Packets to all units of local government. As in past decades, LCOG is prepared to assist all local governments in Lane County by acting as their designated LUCA Liaison.
For local governments, it is important to get an accurate headcount overall, and especially important to get a complete count among hard-to-reach populations that may include a disproportionate number of older residents, lower-income residents, and those with disabilities. Short counts of those individuals can really take a bite out of federal dollars that should be reaching them specifically, and local governments would be stuck with the undercount for ten years.
The LUCA program is one important step in making sure everyone gets counted. Other Census programs should be rolling out over the next couple of years, including a program designed specifically to promote and facilitate community outreach.
December 2016
This month, the Population Research Center (PRC) at Portland State University has released 2016 Certified Population Estimates for all cities and counties in Oregon, and the Census Bureau has released new five-year estimates from the American Community Survey (ACS).
September 2016
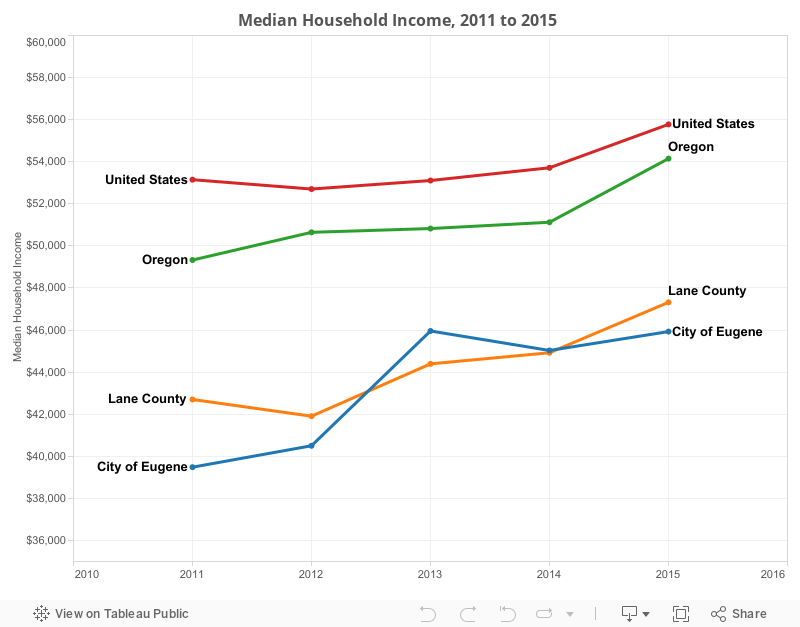
The Census Bureau released new one-year estimates from the American Community Survey (ACS), and the media has been buzzing with the news that household incomes in 2015 increased significantly from the previous year. In fact, the nationwide estimate for median household income shows the largest single-year increase since it began to be measured way back in 1968. Here is a look at how we stand locally, and how we compare to Oregon and the US.
The chart below shows 1-year estimates from the American Community Survey (ACS), in terms of inflation-adjusted 2015 dollars. While the median income in the City of Eugene appears to have slipped back below that of Lane County, the Margins of Error for these geographies are relatively large (on the order of $2,000), and the 2015 estimates are not considered to be "significantly different" from the 2014 or 2013 estimates. ACS 1-year estimates are not tabulated for any other cities within Lane County, and 5-year ACS estimates should not be used for year-to-year comparisons because of the overlap between 5-year sampling windows. Note that the vertical axis does not start at zero. If it did, these lines would appear to be bunched much more tightly together.
For other Census-related information, including links to some Census tables, visit Demographic Information.