
Metropolitan Planning Organization
859 Willamette St.
Suite 500
Eugene, OR 97401
Ph: 541-682-4405
Fx: 541-682-4099
Email: mpo@lcog.org
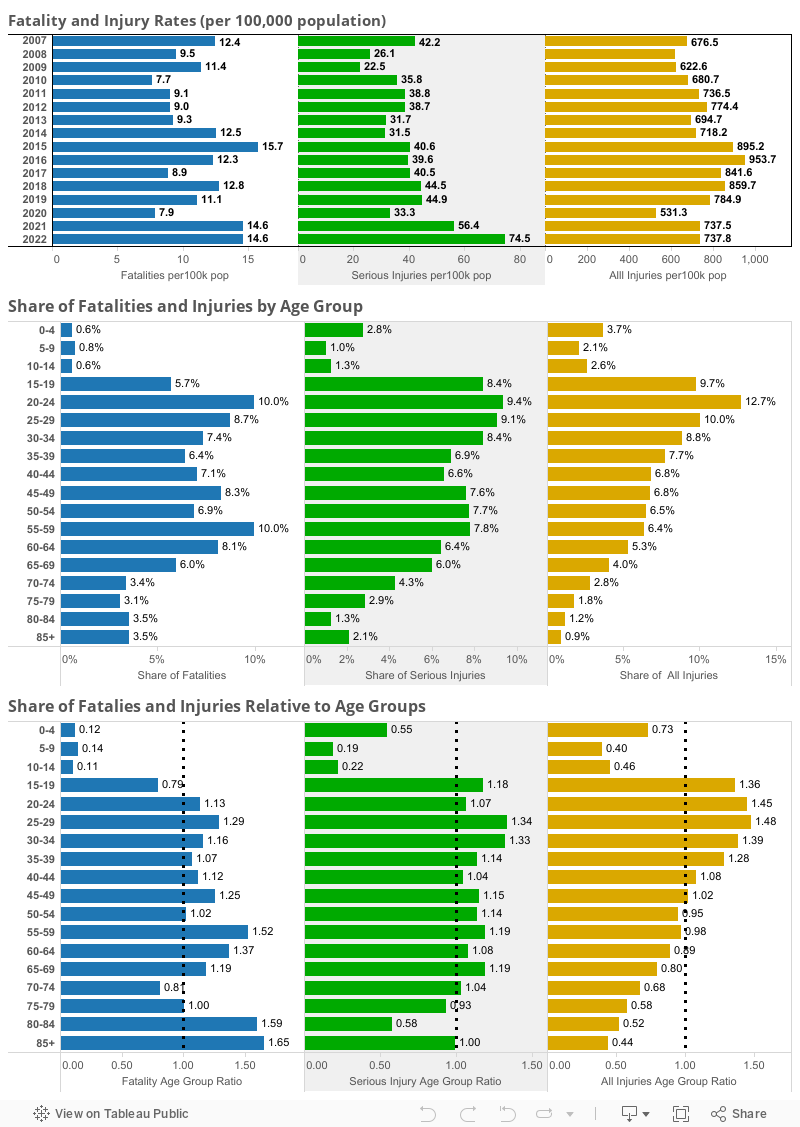
The charts in the top row represent all crash outcomes since 2007, for all of Lane County, by year, normalized by population. The charts in the second and third rows represent all crash outcomes for which victim ages were reported. Hover over the bars to see details. The charts in the second row display the proportions (or shares) of crash outcomes experienced by each age group. Click on an age group in any chart to highlight that same age group in the other charts. The charts in the third row display, for each age group, the ratio between the share of crash outcomes and the share of the overall population. For any given age group, if that ratio is less than 1 (as shown by the dotted vertical line), then that age group experiences fewer fatalities or injuries than would be expected based on their overall share of the total population. If that ratio is greater than 1, then that age group experiences more fatalities or injuries than would be expected based on their overall share of the total population.
(Sources: Crash data from ODOT. Population data from the Population Research Center at Portland State University.)
Metropolitan Planning Organization
859 Willamette St.
Suite 500
Eugene, OR 97401
Ph: 541-682-4405
Fx: 541-682-4099
Email: mpo@lcog.org