
Metropolitan Planning Organization
859 Willamette St.
Suite 500
Eugene, OR 97401
Ph: 541-682-4405
Fx: 541-682-4099
Email: mpo@lcog.org
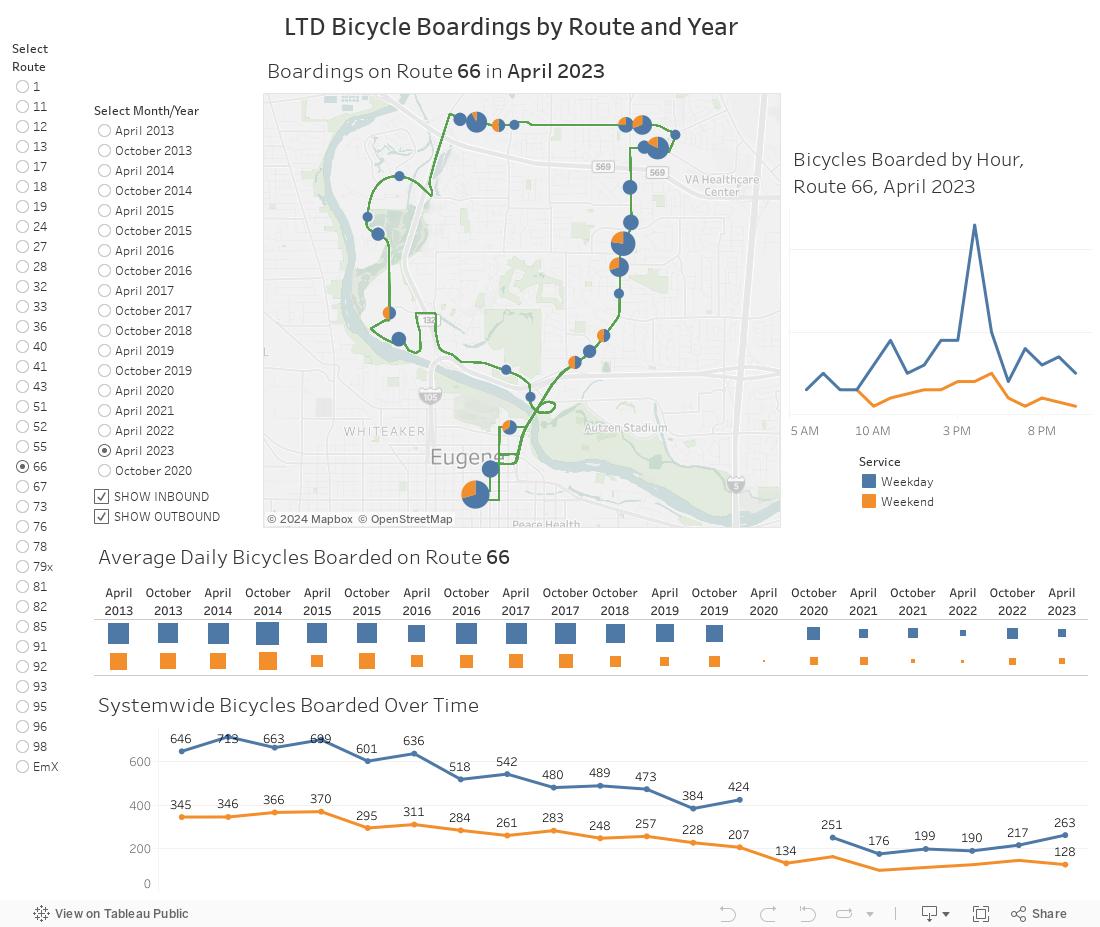
The data visualization below shows data events recorded by Lane Transit District (LTD) bus operators where bus riders mounted their bicycle on the bus. This data is recorded manually by the bus operators so the data may not fully account for every instance of a bicycle being mounted on a bus. The map and charts below represent boardings only, and do not include de-boardings. The dashboard shows both Fall (October) and Spring (April) ridership from data provided to LCOG by LTD.
The map shows bicycle boardings along each bus route for each sampling period. You can select a bus route and the sampling period from the right-hand lists, and choose whether to display Inbound or Outbound bicycle boardings (or both). The smaller line chart shows the hour-by-hour distribution of bicycle boardings. Hover your mouse along that line chart to display the hour-by-hour distribution of bicycle boardings among the stops (you need to pause to give the map time to re-draw).
The box chart below the map summarizes the average daily bicycle boardings for the selected route over time. Hover over the individual boxes to show details. The line graph at the bottom of the dashboard shows the systemwide total daily bicycle boardings over time. The map, the hourly distribution, and the daily average bicycle boardings are all broken out by weekday and weekend service.
If you have questions or comments regarding this dashboard or the underlying data, please contact Ellen Currier, Senior Transportation Planner for Central Lane Metropolitan Planning Organization (CLMPO).
Metropolitan Planning Organization
859 Willamette St.
Suite 500
Eugene, OR 97401
Ph: 541-682-4405
Fx: 541-682-4099
Email: mpo@lcog.org