
Metropolitan Planning Organization
859 Willamette St.
Suite 500
Eugene, OR 97401
Ph: 541-682-4405
Fx: 541-682-4099
Email: mpo@lcog.org
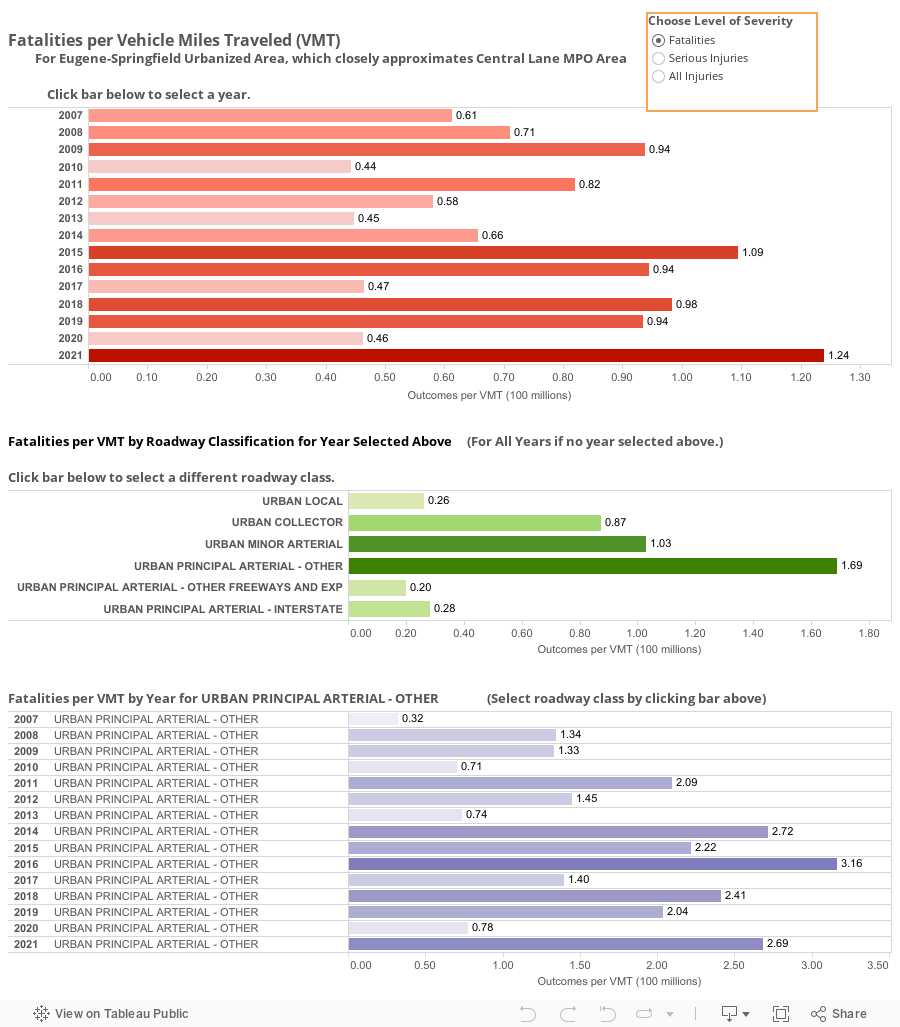
These bar charts show fatality and injury rates normalized by vehicle miles traveled (VMT), by year and by type (class) of roadway, within the Eugene-Springfield urban area (which closely approximates the Central Lane MPO area). Use the radio buttons at the top right to bring up different sets of bar charts for fatalities, serious injuries, and all injuries. For each level of severity, the upper chart shows overall rates by VMT by year, while the middle chart shows rates by VMT for different classes of roadway. Click on any year in the upper chart to filter the middle chart to show data for that year only. Clicking on any roadway class in the middle chart will populate the lower chart with rates by VMT by year for that particular roadway type. In general, freeways and expressways tend to be have lower injury and fatality rates than other types of arterials.
Data Sources:
Crashes and crash severity data from Oregon Dept of Transportation (ODOT).
Central Lane VMT from ODOT Highway Performance Monitoring System (HPMS).
Metropolitan Planning Organization
859 Willamette St.
Suite 500
Eugene, OR 97401
Ph: 541-682-4405
Fx: 541-682-4099
Email: mpo@lcog.org