
Metropolitan Planning Organization
859 Willamette St.
Suite 500
Eugene, OR 97401
Ph: 541-682-4405
Fx: 541-682-4099
Email: mpo@lcog.org
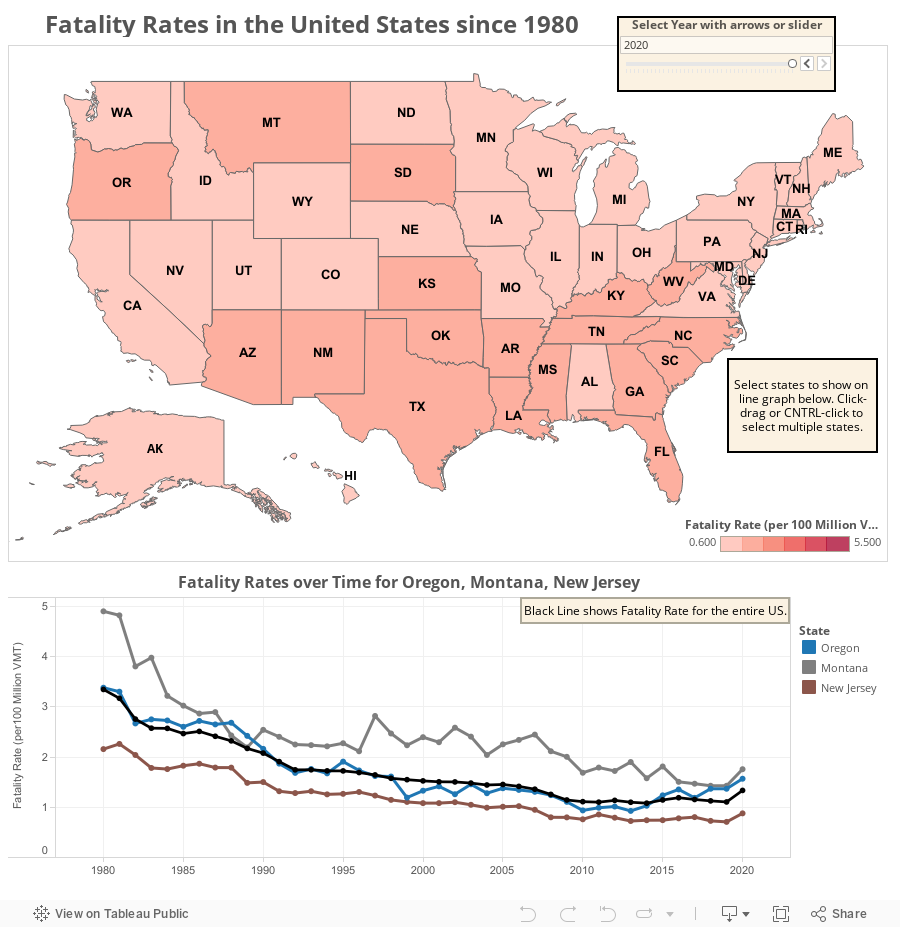
This dashboard displays fatality rates for every state in the US, expressed in terms of traffic-related fatalities per 100 million vehicle miles traveled (VMT).
Choose a year using the slider in the top right, or click through the years with the small arrows. The map displays fatality rates for every state for the selected year. Hover over any state to view additional information. Click on a state to view fatality rates over time on the line graph below the map. The black line on that graph represents the fatality rate for the US as a whole. Hover over the line graph to view additional information. Click on the map again to unselect or to make another selection. Use CTRL-click to select multiple states for comparison.
Rural western states, such as Montana, tend to have fatality rates that are consistently higher than the national average, while urban eastern states, such as New Jersey, tend to have fatality rates that are consistently lower than the national average. Oregon's fatality rate has remained consistently close to the national average. The fatality rates in all states have generally declined over time.
Sources:
Fatalities from National Transportation Safety Administration (NHSTA) Federal Accident Reporting System (FARS). Vehicle Miles Traveled (VMT) from Federal Highway Administration (FHWA, table VM202).
Metropolitan Planning Organization
859 Willamette St.
Suite 500
Eugene, OR 97401
Ph: 541-682-4405
Fx: 541-682-4099
Email: mpo@lcog.org