
Metropolitan Planning Organization
859 Willamette St.
Suite 500
Eugene, OR 97401
Ph: 541-682-4405
Fx: 541-682-4099
Email: mpo@lcog.org
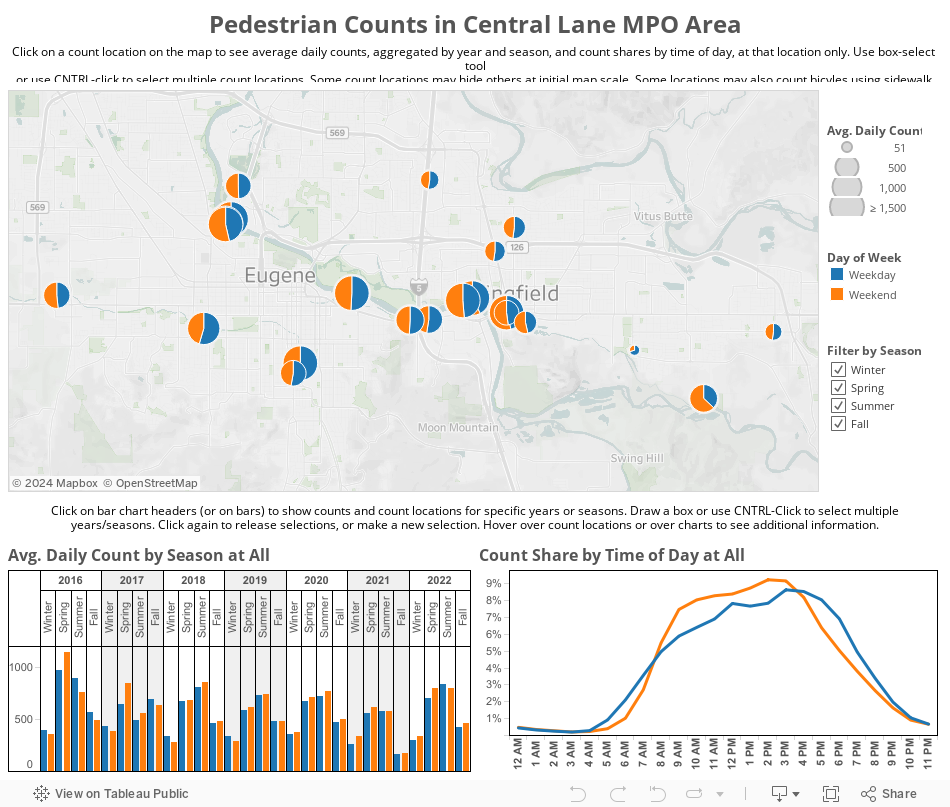
Central Lane MPO has been collecting pedestrian volume data since 2015. The data featured in the interactive map and graphs below represent average daily and hourly pedestrian volumes for both weekdays and weekends. These data are summarized by season to give the user some ability to compare counts taken at the same location over time. Weather conditions, such as temperature and rain, can have a major impact on daily pedestrian volume. The interactive map below will be updated periodically as new data are collected and processed.
Metropolitan Planning Organization
859 Willamette St.
Suite 500
Eugene, OR 97401
Ph: 541-682-4405
Fx: 541-682-4099
Email: mpo@lcog.org